Almost any stock chart can illustrate important market dynamics. Some things are obvious. For example, stocks that are overbought or oversold tend to reverse. Another example is how they can reverse when they reach important price levels.
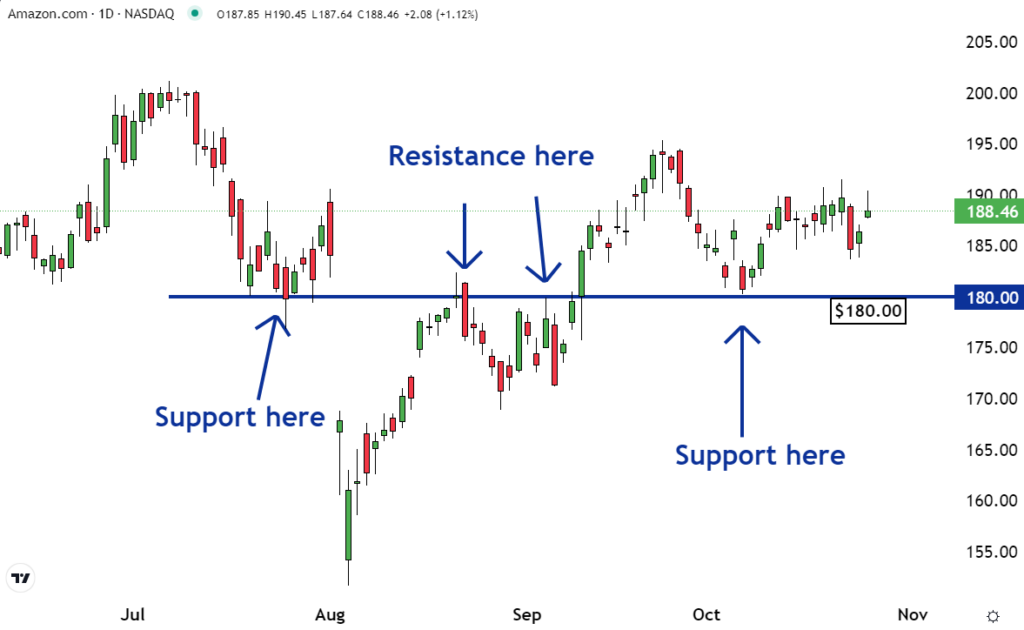
This can be seen on the chart of Amazon.com, Inc. AMZN. This is why it is the Stock of the Day.
The $180 level has been important for Amazon stock. There have been major reversals in the trend when it reached this level going back to July. In early October, $180 was a support level. This isn’t a coincidence. The level was support because it was resistance in late August and early September.
Resistance converting into support is a common occurrence in the financial markets. It is due to seller’s remorse.
Some of the investors and traders who sold Amazon close to $180 thought they made a good decision when the price traded lower soon after. But then the shares ripped through this resistance and moved higher.
When this happened, some of the traders and investors who sold at resistance decided they had made a mistake by selling. Many of them wanted to buy their shares back, but will only do so if they could get them for the same prices they were sold at.

Read Also: Apple Q4 Earnings Preview: Goldman Sachs Analyst Anticipates Big Earnings Beat, Resilient iPhone 16 Demand
As a result, when the stock eventually dropped back to $180, they placed buy orders. This large concentration of these orders created support at the same price where ther had been resistance.
There is also a reason why there was resistance around $180. It isn’t a coincidence either.
There was resistance there because it had been a support level. Support converting into resistance is also a common occurrence in the stock market. This happens because of buyer’s remorse.
Some of the investors and traders who bought shares of Amazon in July thought they did the right thing when the stock moved higher soon after.
But when the support broke and the price dropped below it, many of these previously happy buyers came to think they made a mistake. They decided to sell — if they can do so without losing money.
As a result, when Amazon rallied back to $180, they placed sell orders. There were so many of these orders, it caused resistance to form at the price that had previously been support.
One thing that is obvious when looking at a stock chart is how some price levels can be more important than others. The $180 level for Amazon is one of them.
Read Next:
• What’s Going On With Trump Media & Technology Group Stock On Friday?
Photo: Shutterstock
Market News and Data brought to you by Benzinga APIs
© 2024 Benzinga.com. Benzinga does not provide investment advice. All rights reserved.

